Friday, January 18. 2013
A more complete picture of the iTunes economy
Via ASYMCO
-----
As it did yesterday, on occasion Apple reports the cumulative total downloads and payments to developers. Since this is done in variable time intervals, it makes analysis of the value of the app store difficult.
But not impossible.
The provision of developer revenues means we can determine the pricing of apps. The pricing of apps and the download totals allows us to determine the revenue of the store. Using the time stamps of the reports allows us to determine these quantities over time.
I’ve combined the data we have so far into the following graph.
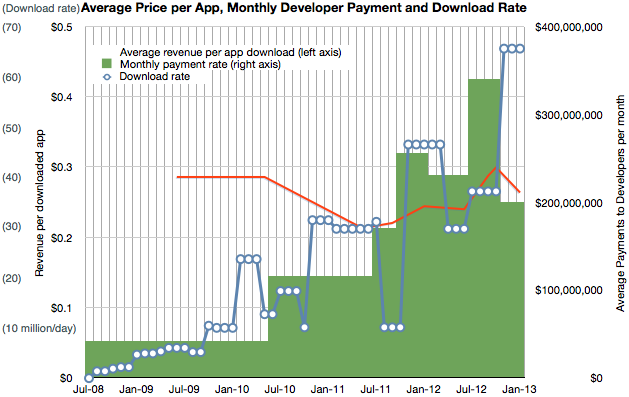
It shows three quantities (on three separate scales) at a monthly resolution:
- Download rate (in millions/day, interpolated from download totals)
- Payment rate to developers (reported change in payment to developers/reported time interval)
- Resulting revenue per download (in red, trailing average over a 10 month period)
Having a price and quantity of app downloads allows for a complete picture of App Store revenues over time, shown below:
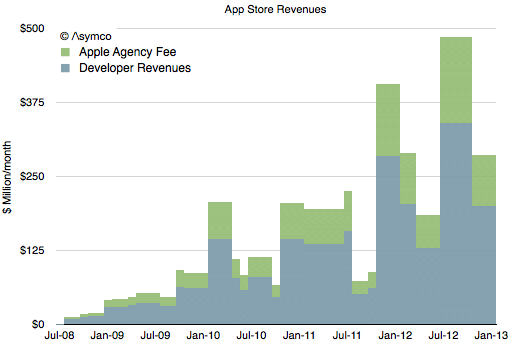
Note that I’ve separated the developer revenues from Apple’s own revenues. The blue area should total cumulative developer payments (to a degree of error.)
The green area above is what Apple includes in its financial reports as part of “Music” revenues. If we annualize these App Store revenues we can strip them out and show them separately from “other media” revenues.

Concentrating on the green areas which represent what Apple “keeps” we see the following split:

Considering that Apple reports the iTunes store to being “slightly above break-even” then we can summarize the chart above as the operating expenses for the store.
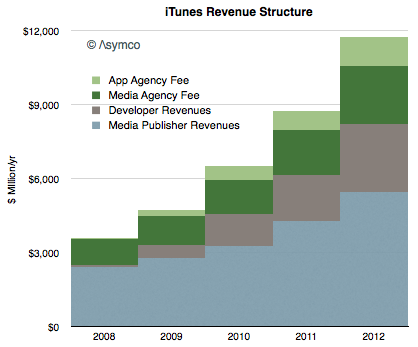
Finally, taking into account all the information above we can draw a complete picture of how revenues flow through the App Store:
Here are some conclusions:
- The iTunes economy defined as gross revenues transacted through it is now about $12 billion/yr.
- Over the last five years content owners (media and app) received a total of $24 billion while Apple spent about $10 billion to create those sales
- Seen as a retail business, iTunes costs about $3.5 billion/yr to operate. This includes merchandising, payment processing and “shipping & handling”.
- Total revenues have risen steadily in a range of 32 to 38% compounded over the last 4 years.
- Apps are now a third of all iTunes revenues, (about $4 billion/yr) having taken that share in only 4.5 years.
- Non-app media still make up 2/3 of iTunes in terms of sales value but their growth is now 28% vs. about 50% for apps.
Quicksearch
Popular Entries
- The great Ars Android interface shootout (131491)
- Norton cyber crime study offers striking revenue loss statistics (102338)
- MeCam $49 flying camera concept follows you around, streams video to your phone (100502)
- The PC inside your phone: A guide to the system-on-a-chip (58677)
- Norton cyber crime study offers striking revenue loss statistics (58567)
Categories

Show tagged entries
Syndicate This Blog
Calendar
|
|
July '26 | |||||
| Mon | Tue | Wed | Thu | Fri | Sat | Sun |
| 1 | 2 | 3 | 4 | 5 | ||
| 6 | 7 | 8 | 9 | 10 | 11 | 12 |
| 13 | 14 | 15 | 16 | 17 | 18 | 19 |
| 20 | 21 | 22 | 23 | 24 | 25 | 26 |
| 27 | 28 | 29 | 30 | 31 | ||