It turns out that a vital missing ingredient in the long-sought after
goal of getting machines to think like humans—artificial
intelligence—has been lots and lots of data.
Last week, at the O’Reilly Strata + Hadoop World Conference in New York, Salesforce.com’s head of artificial intelligence, Beau Cronin, asserted that AI has gotten a shot in the arm from the big data movement.
“Deep learning on its own, done in academia, doesn’t have the [same]
impact as when it is brought into Google, scaled and built into a new
product,” Cronin said.
In the week since Cronin’s talk, we saw a
whole slew of companies—startups mostly—come out of stealth mode to
offer new ways of analyzing big data, using machine learning, natural
language recognition and other AI techniques that those researchers have
been developing for decades.
One such startup, Cognitive Scale,
applies IBM Watson-like learning capabilities to draw insights from
vast amount of what it calls “dark data,” buried either in the Web—Yelp
reviews, online photos, discussion forums—or on the company network,
such as employee and payroll files, noted KM World.
Cognitive
Scale offers a set of APIs (application programming interfaces) that
businesses can use to tap into cognitive-based capabilities designed to
improve search and analysis jobs running on cloud services such as IBM’s Bluemix, detailed the Programmable Web.
Cognitive Scale was founded by Matt Sanchez, who headed up IBM’s Watson Labs,
helping bring to market some of the first e-commerce applications based
on the Jeopardy-winning Watson technology, pointed out CRN.
Sanchez,
now chief technology officer for Cognitive Scale, is not the only
Watson alumnus who has gone on to commercialize cognitive technologies.
Alert reader Gabrielle Sanchez pointed out that another Watson ex-alum, engineer Pete Bouchard, recently joined the team of another cognitive computing startup Zintera
as the chief innovation office. Sanchez, who studied cognitive
computing in college, found a demonstration of the company’s “deep
learning” cognitive computing platform to be “pretty impressive.”
AI-based deep learning with big data was certainly on the mind of senior Google executives. This week the company snapped up two Oxford University technology spin-off companies that focus on deep learning, Dark Blue Labs and Vision Factory.
The teams will work on image recognition and natural language understanding, Sharon Gaudin reported in Computerworld.
Sumo Logic
has found a way to apply machine learning to large amounts machine
data. An update to its analysis platform now allows the software to
pinpoint casual relationships within sets of data, Inside Big Data concluded.
A company could, for instance, use the Sumo Logic cloud service to analyze log data to troubleshoot a faulty application, for instance.
While companies such as Splunk have long offered search engines for machine data, Sumo Logic moves that technology a step forward, the company claimed.
“The
trouble with search is that you need to know what you are searching
for. If you don’t know everything about your data, you can’t by
definition, search for it. Machine learning became a fundamental part of
how we uncover interesting patterns and anomalies in data,” explained
Sumo Logic chief marketing officer Sanjay Sarathy, in an interview.
For
instance, the company, which processes about 5 petabytes of customer
data each day, can recognize similar queries across different users, and
suggest possible queries and dashboards that others with similar setups
have found useful.
“Crowd-sourcing intelligence around different
infrastructure items is something you can only do as a native cloud
service,” Sarathy said.
With Sumo Logic, an e-commerce company
could ensure that each transaction conducted on its site takes no longer
than three seconds to occur. If the response time is lengthier, then an
administrator can pinpoint where the holdup is occurring in the transactional flow.
One existing Sumo Logic customer, fashion retailer Tobi, plans to use the new capabilities to better understand how its customers interact with its website.
One-upping IBM on the name game is DataRPM, which crowned its own big data-crunching natural language query engine Sherlock (named after Sherlock Holmes who, after all, employed Watson to execute his menial tasks).
Sherlock
is unique in that it can automatically create models of large data
sets. Having a model of a data set can help users pull together
information more quickly, because the model describes what the data is
about, explained DataRPM CEO Sundeep Sanghavi.
DataRPM can analyze
a staggeringly wide array of structured, semi-structured and
unstructured data sources. “We’ll connect to anything and everything,”
Sanghavi said.
The service company can then look for ways that different data sets could be combined to provide more insight.
“We
believe that data warehousing is where data goes to die. Big data is
not just about size, but also about how many different sources of data
you are processing, and how fast you can process that data,” Sanghavi
said, in an interview.
For instance, Sherlock can pull together
different sources of data and respond with a visualization to a query
such as “What was our revenue for last year, based on geography?” The
system can even suggest other possible queries as well.
Sherlock
has a few advantages over Watson, Sanghavi claimed. The training period
is not as long, and the software can be run on-premise, rather than as a
cloud service from IBM, for those shops that want to keep their
computations in-house. “We’re far more affordable than Watson,” Sanghavi
said.
Initially, DataRPM is marketing to the finance, telecommunications, manufacturing, transportation and retail sectors.
One company that certainly does not think data warehousing is going to die is a recently unstealth’ed startup run by Bob Muglia, called Snowflake Computing.
Publicly
launched this week, Snowflake aims “to do for the data warehouse what
Salesforce did for CRM—transforming the product from a piece of
infrastructure that has to be maintained by IT into a service operated
entirely by the provider,” wrote Jon Gold at Network World.
Founded
in 2012, the company brought in Muglia earlier this year to run the
business. Muglia was the head of Microsoft’s server and tools division,
and later, head of the software unit at Juniper Networks.
While Snowflake could offer its software as a product, it chooses to do so as a service, noted Timothy Prickett Morgan at Enterprise Tech.
“Sometime
either this year or next year, we will see more data being created in
the cloud than in an on-premises environment,” Muglia told Morgan.
“Because the data is being created in the cloud, analysis of that data
in the cloud is very appropriate.”
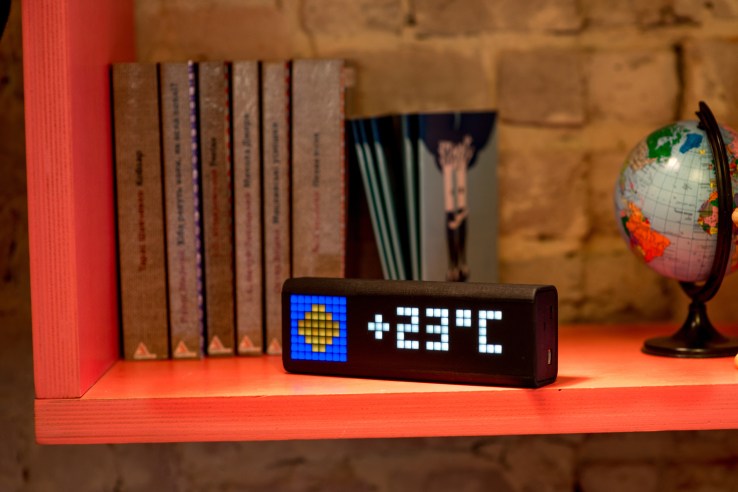
Ever since covering Fliike,
a beautifully-designed physical ‘Like’ counter for local businesses,
I’ve been thinking about how the idea could be extended, with a
fully-programmable, but simple, ticker-style Internet-connected display.
A few products along those lines do already exist, but I’ve yet to
find anything that quite matches what I had in mind. That is, until
recently, when I was introduced to LaMetric, a smart ticker being
developed by UK/Ukraine Internet of Things (IoT) startup Smart Atoms.
Launching
its Kickstarter crowdfunding campaign today, the LaMetric is aimed at
both consumers and businesses. The idea is you may want to display
alerts, notifications and other information from your online “life” via
an elegant desktop or wall-mountable and glance-able display. Likewise,
businesses that want an Internet-connected ticker, displaying various
business information, either publicly for customers or in an office, are
also a target market.
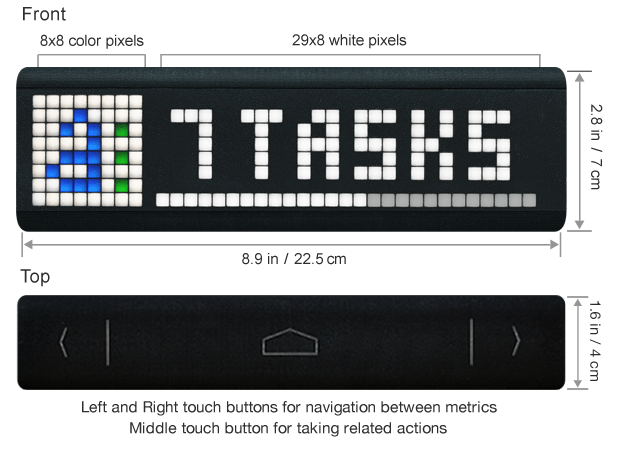
The
device itself has a retro, 8-bit style desktop clock feel to it, thanks
to its ‘blocky’ LED light powered display, which is part of its charm.
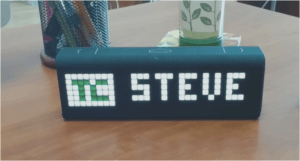
The display can output one icon and seven numbers, and is scrollable.
But, best of all, the LaMetric is fully programmable via the
accompanying app (or “hackable”) and comes with a bunch of off-the-shelf
widgets, along with support for RSS and services like IFTTT, Smart
Things, Wig Wag, Ninja Blocks, so you can get it talking to other smart
devices or web services. Seriously, this thing goes way beyond what I
had in mind — try the simulator for yourself — and, for an IoT junkie like me, is just damn cool.
Examples of the kind of things you can track with the device include
time, weather, subject and time left till your next meeting, number of
new emails and their subject lines, CrossFit timings and fitness goals,
number of to-dos for today, stock quotes, and social network
notifications.
Or for businesses, this might include Facebook Likes, website
visitors, conversions and other metrics, app store rankings, downloads,
and revenue.
In addition to the display, the device has back and forward buttons
so you can rotate widgets (though these can be set to automatically
rotate), as well as an enter key for programmed responses, such as
accepting a calendar invitation.
There’s also a loudspeaker for audio alerts. The LaMetric is powered
by micro-USB and also comes as an optional and more expensive
battery-powered version.
Early-bird backers on Kickstarter can pick up the LaMetric for as
little as $89 (plus shipping) for the battery-less version, with
countless other options and perks, increasing in price.
Projection mapping, where ordinary objects become surfaces for moving images, is an increasingly common video technique in applications like music videos, phone commercials, and architectural light shows — and now a new film shows what can happen when you add robots to the mix. In Box, a performance artist works with transforming panels hoisted by industrial machineryin
a dazzling demonstration of projection mapping's mind-bending
possibilities. Every effect is captured in-camera, and each section
eventually reveals how the robot arms were used.
It's the work of San Francisco
studio Bot & Dolly, which believes its new technology can "tear down
the fourth wall" in the theater. "Through large-scale robotics,
projection mapping and software engineering, audiences will witness the
trompe l'oeil effect pushed to new boundaries," says creative director
Tarik Abdel-Gawad. "We believe this methodology has tremendous potential
to radically transform visual art forms and define new genres of
expression." Box is an effective demonstration of the studio's
projection mapping system, but it works in its own right as an
enthralling piece of art.
Fed up with the NSA’s infringement of privacy, an internet user by the name of Sang Mun has developed a font which cannot be read by computers.
Called ‘ZXX’, which is used by the Library of Congress to
state that a document has “no linguistic content”, the font is garbled
up in such a way that computers with Optical Character Recognition (OCR)
will not be able to recognize it.
Available in four “disguises”, this font uses camouflage
techniques to trick the computers of governments and corporations into
thinking that no useful information can be collated from people, while
remaining readable to the human eye.
The font developer urges users to fight against this infringement of privacy, and has made this font free for all users on his website.
Wikipedia is constantly growing, and it is written by people around the world. To illustrate this, we created a map of recent changes on Wikipedia, which displays the approximate location of unregistered users and the article that they edit.
Unregistered Wikipedia users
When an unregistered user makes a contribution to Wikipedia,
he or she is identified by his or her IP address. These IP addresses
are translated to the contributor’s approximate geographic location. A study by Fabian Kaelin in 2011 noted that unregistered users make approximately 20% of the edits on English Wikipedia [edit: likely closer to 15%, according to more recent statistics], so Wikipedia’s stream of recent changes includes many other edits that are not shown on this map.
You may see some users add non-productive or disruptive content to Wikipedia. A survey in 2007 indicated
that unregistered users are less likely to make productive edits to the
encyclopedia. Do not fear: improper edits can be removed or corrected by other users, including you!
How it works
This map listens to live feeds of Wikipedia revisions, broadcast using wikimon. We built the map using a few nice libraries and services, including d3, DataMaps, and freegeoip.net. This project was inspired by WikipediaVision’s (almost) real-time edit visualization.
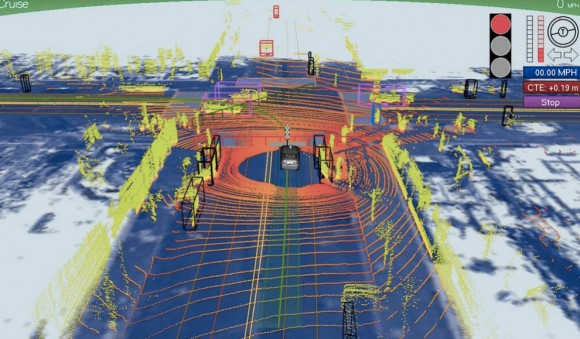
We’ve been hearing a lot about Google‘s
self-driving car lately, and we’re all probably wanting to know how
exactly the search giant is able to construct such a thing and drive
itself without hitting anything or anyone. A new photo has surfaced that
demonstrates what Google’s self-driving vehicles see while they’re out
on the town, and it looks rather frightening.
The image was tweeted
by Idealab founder Bill Gross, along with a claim that the self-driving
car collects almost 1GB of data every second (yes, every second). This
data includes imagery of the cars surroundings in order to effectively
and safely navigate roads. The image shows that the car sees its
surroundings through an infrared-like camera sensor, and it even can
pick out people walking on the sidewalk.
Of course, 1GB of data every second isn’t too surprising when you
consider that the car has to get a 360-degree image of its surroundings
at all times. The image we see above even distinguishes different
objects by color and shape. For instance, pedestrians are in bright
green, cars are shaped like boxes, and the road is in dark blue.
However, we’re not sure where this photo came from, so it could
simply be a rendering of someone’s idea of what Google’s self-driving
car sees. Either way, Google says that we could see self-driving cars
make their way to public roads in the next five years or so, which actually isn’t that far off, and Tesla Motors CEO Elon Musk is even interested in developing self-driving cars as well. However, they certainly don’t come without their problems, and we’re guessing that the first batch of self-driving cars probably won’t be in 100% tip-top shape.
Abstract While playing around with the Nmap Scripting Engine
(NSE) we discovered an amazing number of open embedded devices on the
Internet. Many of them are based on Linux and allow login to standard
BusyBox with empty or default credentials. We used these devices to
build a distributed port scanner to scan all IPv4 addresses. These scans
include service probes for the most common ports, ICMP ping, reverse
DNS and SYN scans. We analyzed some of the data to get an estimation of
the IP address usage.
All data gathered during our research is released into the public domain for further study.
He called himself “MSP,” and he appeared out of nowhere, launching a
one-man flame war against a sacred cow of hardcore computing: the
command line.
The venue was TuxRadar, a news and reviews site that shines a
spotlight on the Linux operating system and other open source software.
The site had just published a piece
in praise of the command line — where you interact with a computer by
passing it line after line of text, rather than using a graphical user
interface, or GUI. “The command line isn’t a crusty, old-fashioned way
to interact with a computer, made obsolete by GUIs, but rather a
fantastically flexible and powerful way to perform tasks,” the site
said.
Then MSP appeared with his flame thrower. “There seem to be a number
of obvious errors in the introduction to this article,” he wrote. “The
command line is a crusty, old-fashioned way to interact with a computer,
made obsolete by GUIs, but a small hardcore of people who refuse to
move on still use it.”
As he likely expected, the Linux-happy commenters at TuxRadar didn’t
take kindly to his “corrections.” Dozens vehemently defended the command
line, insisting it still has a very important place in the world of
computing. And they’re right. Though the average computer user has no
need for a command line, it’s still an essential tool for developers and
system adminstrators who require access to guts of our machines — and
it’s not going away anytime soon.
“People drive cars with steering wheels and gas pedals. Does that
mean you don’t need wrenches?” says Rob Pike, who was part of the team
at Bell Labs that developed the UNIX operating system and now works at
Google, where he oversaw the creation of the Go programming language.
Back in ’70s and early ’80s, if you used a computer, you used a
command line. DOS — the disk operating system that runs atop IBM PCs —
used a command line interface, and that’s what UNIX used too. But then
came the Apple Macintosh and Microsoft Windows, and by the mid-’90s,
most of us had moved to GUIs. The GUI is more effective when you’re
navigating an operating system you’re not exactly familiar with, but
also when you’re typing large amounts of text. Your word processor, for
instance, uses a WYSIWYG, or what-you-see-is-what-you-get graphical
interface.
“Try creating a complex document in a mark-up language using a text
editor,” writes one commenter on TuxRadar. “It can be done, but
generally using a graphical WYSIWYG interface is a far faster and
accurate approach.”
GUIs have even reinvented the world of software development,
beginning with tools like Visual Basic, before extending coding tasks to
the average joe with new-age tools such as Scratch and Google’s App Inventor.
But among hardcore computer types — i.e., the audience reading
TuxRadar — the command line persists. If you’re a developer or a
sysadmin, there are times when it makes more sense to use the command
line interface, or “shell,” built into operating systems like Linux and
UNIX. “It depends on what you’re doing,” Pike tells Wired. “All
computing, at some level, is abstraction and yet deep down beneath there
are hardware instructions doing the job. It depends on the level you’re
working at.”
In some cases, command line interfaces provide access to lower levels
of a machine’s software and hardware. And they’re often easier to
manipulate with “scripts,” mini text programs that automate processes
for system adminstrators and others.
“Anyone insisting the command line is a relic of a by-gone time is
hopelessly deluded,” argues another commenter in the Tuxradar debate. “I
have a very nice [desktop] set up at home, with lots of graphical
applications, but I just find it quicker to write scripts and use the
shell than to hunt through menus to find what I want.”
But in other cases, geeks like command lines just because you have to
know what you’re doing to use it. You have to know the commands. You
can’t hunt and peck like you do with a GUI.
Pike calls the kerfuffle sparked by MSP a “sterile debate.” But MSP
insists that the command line should disappear. The problem, he writes,
is that GUIs just aren’t as effective as they should be. “When people
using a particular system say ‘the command line is better because it can
do things you can’t do in the GUI’ they are not talking about the
strengths of the command line interface, but about the shortcomings in
the GUI,” he says.
OK. Fine. But until the GUI evolves again, the command is here to stay.
Korean Emart recently placed 3D QR code sculptures throughout the city of Seoul that could only be scanned between noon and 1 pm each day — consumers were given discounts at the store during those quiet shopping hours.
Periodic lulls in business are a fact of life for most retailers, and we’ve already seen solutions including daily deals that are valid only during those quiet times. Recently, however, we came across a concept that takes such efforts even further. Specifically, Korean Emart recently placed 3D QR code sculptures throughout the city of Seoul that could only be scanned between noon and 1 pm each day — consumers who succeeded were rewarded with discounts at the store during those quiet shopping hours.
Dubbed “Sunny Sale,” Emart’s effort involved setting up a series of what it calls “shadow” QR codes that depend on peak sunlight for proper viewing and were scannable only between 12 and 1 pm each day. Successfully scanning a code took consumers to a dedicated home page with special offers including a coupon worth USD 12. Purchases could then be made via smartphone for delivery direct to the consumer’s door. The video below explains the campaign in more detail:
As a result of its creative promotion, Emart reportedly saw membership increase by 58 percent in February over the previous month, they also observed a 25 percent increase in sales during lunch hours. Retailers around the globe: One for inspiration?