Friday, October 10. 2014
More Than Meets the Eye: NASA Scientists Listen to Data
Via NASA
-----
Robert Alexander spends parts of his day listening to a soft white noise, similar to water falling on the outside of a house during a rainstorm. Every once in a while, he hears an anomalous sound and marks the corresponding time in the audio file. Alexander is listening to the sun’s magnetic field and marking potential areas of interest. After only ten minutes, he has listened to one month’s worth of data.
Alexander is a PhD candidate in design science at the University of Michigan. He is a sonification specialist who trains heliophysicists at NASA’s Goddard Space Flight Center in Greenbelt, Maryland, to pick out subtle differences by listening to satellite data instead of looking at it.
Sonification is the process of displaying any type of data or measurement as sound, such as the beep from a heart rate monitor measuring a person’s pulse, a door bell ringing every time a person enters a room, or, in this case, explosions indicating large events occurring on the sun. In certain cases, scientists can use their ears instead of their eyes to process data more rapidly -- and to detect more details – than through visual analysis. A paper on the effectiveness of sonification in analyzing data from NASA satellites was published in the July issue of Journal of Geophysical Research: Space Physics.
“NASA produces a vast amount of data from its satellites. Exploring such large quantities of data can be difficult,” said Alexander. "Sonification offers a promising supplement to standard visual analysis techniques.”
LISTENING TO SPACE
Alexander's focus is on improving and quantifying the success of these techniques. The team created audio clips from the data and shared them with researchers. While the original data from the Wind satellite was not in audio file format, the satellite records electromagnetic fluctuations that can be converted directly to audio samples. Alexander and his team used custom written computer algorithms to convert those electromagnetic frequencies into sound. Listen to the following multimedia clips to hear the sounds of space.
This clip has three distinct sections: a warble noise leading up to a short knock at slightly higher frequency followed by a quieter segment containing broadband noise that is both rising and hissing. This clip gathered from NASA's Wind satellite on Nov. 20, 2007, contains a reverse shock. This type of event occurs when a fast stream of plasma – that is, the super hot, charged gas that fills space— is followed by a slower one, resulting in a shock wave that travels towards the sun.
This audio clip is the previous clip played backwards. Here, trained listeners will notice the reverse shock event played backwards sounds similar to forward shock event.
This clip contains audified data from the joint European Space Agency (ESA) and NASA Ulysses satellite gathered on October 26, 1995. The participant in Alexander's study was able to detect artificial noise produced from the instrument, which he did not notice in previous visual analysis. Here, the artificial noise can be heard as a drifting tone.
PROCESSING AN OVERWHELMING AMOUNT OF DATA
Alexander's focus is on using clips like these to quantify and improve sonification techniques in order to speed up access to the incredible amounts of data provided by space satellites. For example, he works with space scientist Robert Wicks at NASA Goddard to analyze the high-resolution observations of the sun. Wicks studies the constant stream of particles from our closest star, known as the solar wind – a wind that can cause space weather effects that interfere with human technology near Earth. The team uses data from NASA's Wind satellite. Launched in 1994, Wind orbits a point in between Earth and the sun, constantly observing the temperature, density, speed and the magnetic field of the solar wind as it rushes past.
Wicks analyzes changes in Wind's magnetic field data. Such data not only carries information about the solar wind, but understanding such changes better might help give a forewarning of problematic space weather that can affect satellites near Earth. The Wind satellite also provides an abundance of magnetometer data points, as the satellite measures the magnetic field 11 times per second. Such incredible amounts of information are beneficial -- but only if all the data can be analyzed.
“There is a very long, accurate time series of data, which gives a fantastic view of solar wind changes and what’s going on at small scales,” said Wicks. “There's a rich diversity of physical processes going on, but it is more data than I can easily look through.”
The traditional method of processing the data involves making an educated assertion about where a certain event in the solar wind -- such as subtle wave movements made by hot plasma -- might show up and then visually searching, which can be very time consuming. Instead, Alexander listens to sped up versions of the Wind data and compiles a list of noteworthy regions that scientists like Wicks can return to and further analyze, expediting the process.
In one example, Alexander’s team analyzed data points from the Wind satellite from November 2007, condensing three hours of real-time recording to a three second audio clip. To an untrained ear, the data sounds like a microphone recording on a windy day. When Alexander presented these sounds to a researcher, however, the researcher could identify a distinct chirping at the beginning of the audio clip followed by a percussive event, culminating in a loud boom.
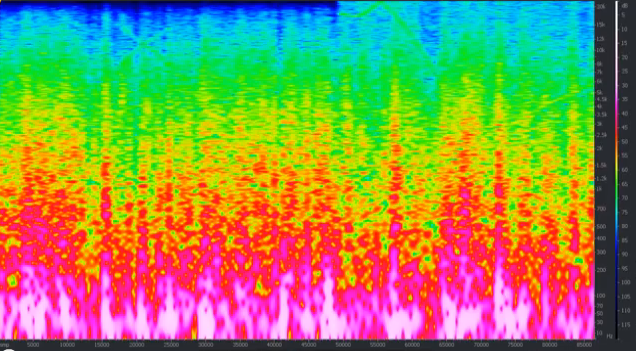
By listening only to the auditory representation of the data, the study’s participant was able to correctly predict what this would look like on a more traditional graph. He correctly deduced that that the chirp would show up as a particular kind of peak on a kind of graph called a spectrogram, a graph that shows different levels of frequencies present in the waves that Wind recorded. The researcher also correctly predicted that the corresponding spectrogram representation of the percussive event would display a steep slope.
CONVERTING DATA INTO SOUND
Alexander translates the data into audio files through a process known as audification, a specific type of sonification that involves directly listening to raw, unedited satellite data. Translating this data into audio can be likened to part of the process of collecting sound from a person singing into a microphone at a recording studio with reel-to-reel tape. When a person sings into a microphone, it detects changes in pressure and converts the pressure signals to changes in magnetic intensity in the form of an electrical signal. The electrical signals are stored on the reel tape. Magnetometers on the Wind satellite measure changes in magnetic field directly creating a similar kind of electrical signal. Alexander writes a computer program to translate this data to an audio file.
“The tones come out of the data naturally. If there is a frequency embedded in the data, then that frequency becomes audible as a sound,” said Alexander.
Listening to data is not new. In a study in 1982, researchers used audification to identify micrometeroids, or small ring particles, hitting the Voyager 2 spacecraft as it traversed Saturn's rings. The impacts were visually obscured in the data but could be easily heard – sounding like intense impulses, almost like a hailstorm.
However, the method is not often used in the science community because it requires a certain level of familiarity with the sounds. For instance, the listener needs to have an understanding of what typical solar wind turbulence sounds like in order to identify atypical events. “It’s about using your ear to pick out subtle differences,” Alexander said.
Alexander initially spent several months with Wicks teaching him how to listen to magnetometer data and highlighting certain elements. But the hard work is paying off as analysis gets faster and easier, leading to new assessments of the data.
“I’ve never listened to the data before,” said Wicks. “It has definitely opened up a different perspective.”
Kasha Patel
NASA’s Goddard Space Flight Center, Greenbelt, Md.
Quicksearch
Popular Entries
- The great Ars Android interface shootout (131533)
- Norton cyber crime study offers striking revenue loss statistics (102451)
- MeCam $49 flying camera concept follows you around, streams video to your phone (100547)
- The PC inside your phone: A guide to the system-on-a-chip (58719)
- Norton cyber crime study offers striking revenue loss statistics (58680)
Categories

Show tagged entries
Syndicate This Blog
Calendar
|
|
July '26 | |||||
| Mon | Tue | Wed | Thu | Fri | Sat | Sun |
| 1 | 2 | 3 | 4 | 5 | ||
| 6 | 7 | 8 | 9 | 10 | 11 | 12 |
| 13 | 14 | 15 | 16 | 17 | 18 | 19 |
| 20 | 21 | 22 | 23 | 24 | 25 | 26 |
| 27 | 28 | 29 | 30 | 31 | ||