Friday, May 06. 2011
Visual Dashboard
-----
The data entered by millions of social-network users could be turned into revealing infographics.
Ever wondered just how much coffee you drank last year, or which movies you saw, and when? New Web and mobile apps make it possible to track, and visualize, this personal information graphically, and the trend could be set to expand dramatically.
This is because Facebook recently acquired one of the leading personal-data-tracking mobile apps and hired its creators. The social-networking giant could be gearing up to offer users ways to chart the minutiae of their lives with personalized infographics.
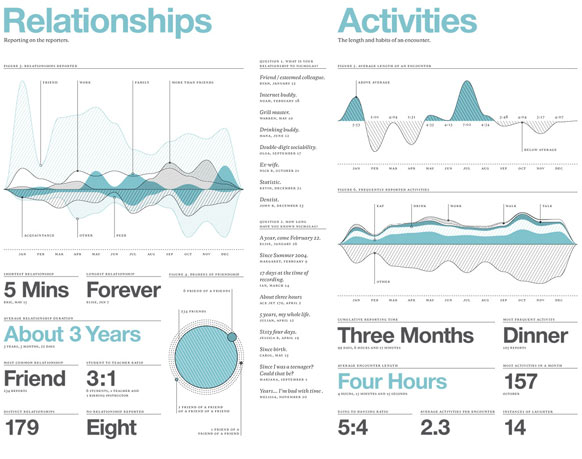
Nick Felton and Ryan Case, two New York-based designers, have pioneered turning the mundane contours of an everyday life into a kind of visual narrative. Each year, Felton publishes an "annual report" on his own life: an infographic that charts out his habits and lifestyle in great detail.
Felton and Case have also created a mobile app, called Daytum, that lets users gather personal data and represent it using infographics. Daytum already has 80,000 users, whose pages provide a detailed snapshot of everything from coffee drinking habits to baseball stadium visits. The app gives users the ability to easily record their own information, whatever it might be, and display it in an attractive manner, whether or not they are a designer.
Daytum is part of a larger trend in tracking personal information. But traditional personal tracking applications tend to revolve around medical data, sleep schedules, and the like. In Felton's creative visualizations, even something as mundane as how many concerts he attended in the past year becomes a kind of art. "I think there's storytelling potential in data," he says.
Felton says he can't talk about what he'll be doing at Facebook, but says, "Clearly, companies like Facebook recognize the value of the kind of work we were doing."
Quicksearch
Popular Entries
- The great Ars Android interface shootout (131479)
- Norton cyber crime study offers striking revenue loss statistics (102326)
- MeCam $49 flying camera concept follows you around, streams video to your phone (100495)
- The PC inside your phone: A guide to the system-on-a-chip (58655)
- Norton cyber crime study offers striking revenue loss statistics (58555)
Categories

Show tagged entries
Syndicate This Blog
Calendar
|
|
July '26 | |||||
| Mon | Tue | Wed | Thu | Fri | Sat | Sun |
| 1 | 2 | 3 | 4 | 5 | ||
| 6 | 7 | 8 | 9 | 10 | 11 | 12 |
| 13 | 14 | 15 | 16 | 17 | 18 | 19 |
| 20 | 21 | 22 | 23 | 24 | 25 | 26 |
| 27 | 28 | 29 | 30 | 31 | ||